In this post, we have explored the major metrics you should consider when planning content, but there are a wealth of options you can use to hone in on your target audience. If you want to establish a competitive advantage, there is sure to be a metric that can inform your tactics.
Gauge User Engagement
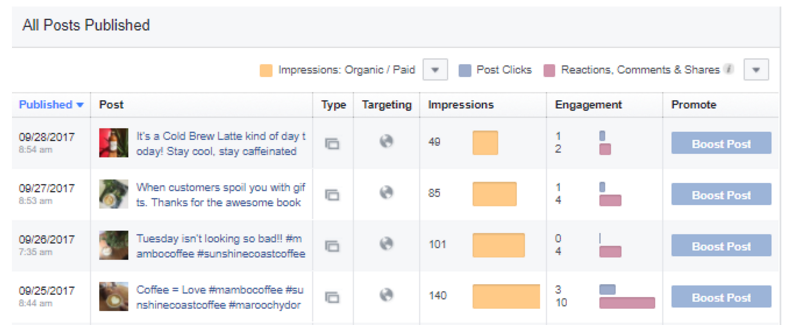
Engagement refers simply to the number of times users engage with your Facebook page, through comments, likes, shares and retweets. Insights allows page admins to identify metrics on specific forms of content, such as videos, links, informative posts or questions. If you recently posted a video that you believe was particularly interesting or resonant to your audience, engagement metrics will confirm if your intent was successful.
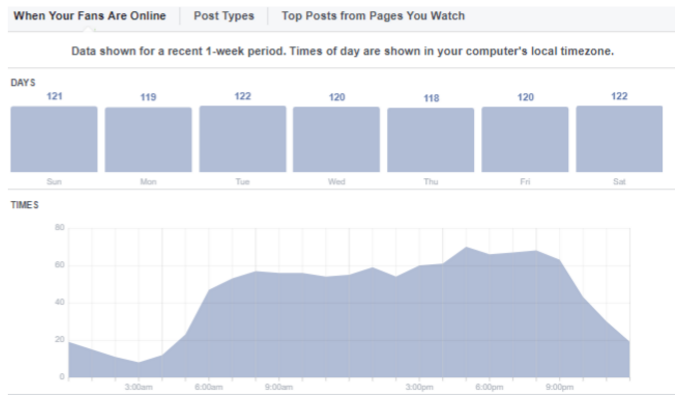
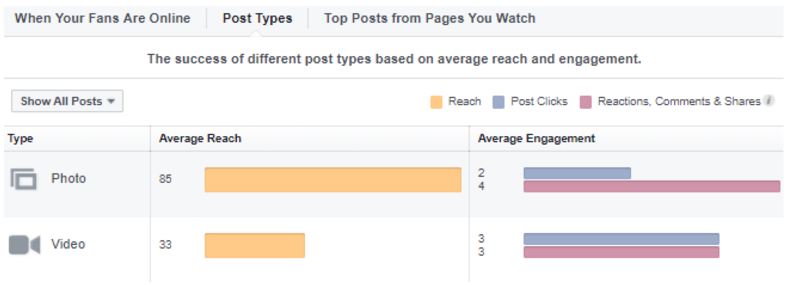
Facebook Insights provides a ‘Posts’ section for measuring engagement. In this section, you can look at graphs of when your viewers are online, as well as information on what types of posts receive the best engagement statistics, such as photos against videos.
Register The Reach of Your Content
In simple terms, reach is the number of people who see the content you offer. Facebook uses algorithms to determine if and where your content appears on a user’s news feed – this means that just because you have a certain number of followers for your page, they will not all necessarily view every piece of your content.
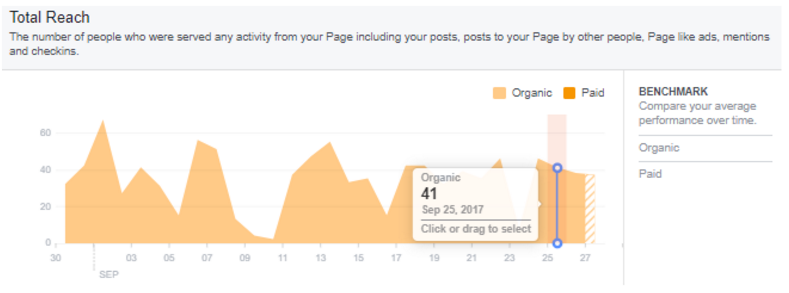
By viewing the reach metrics of your business page, you can break down searches for your page into organic or viral searches, or searches driven by paid advertising. For those who have only recently started a business page, the figures produced might be a little underwhelming. An ideal tactic is to produce content likely to be shared, in an effort to increase viral searches.
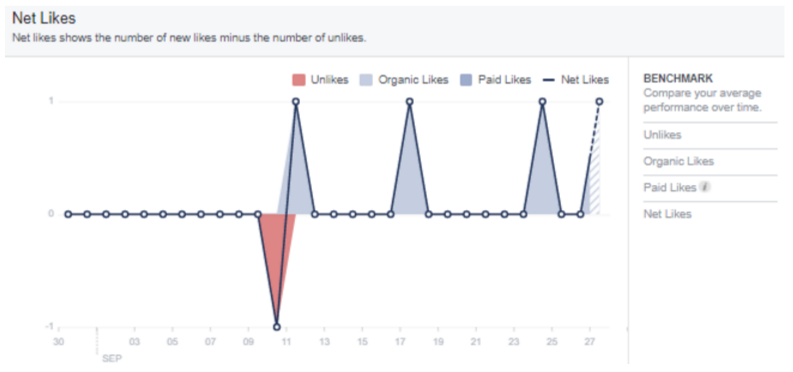
Facebook Insights can provide a comprehensive breakdown of the demographics who have ‘liked’ your business page. Percentages on age, gender and hometown location are offered for everyone who ‘likes’ your page, allowing you to target particular audiences with your content.
You can even pinpoint the number of people who have ‘unliked’ your page at certain times – if there is a large spike in ‘unlikes’ on a particular day, it may have been precipitated by controversial content or too many posts being made in a short period of time.
Interpret Your Impressions
Impressions are the number of times content related to your page is viewed by your audience. An old marketing adage states that potential customers must hear or view the message provided by an advertiser seven times before they engage with that advertiser. This rule is still relevant in modern social media, and businesses have more opportunity than ever to reach an audience multiple times in the digital age.
By using Insights to view the viral engagement of your content, you can determine whether audiences are exposed to your business multiple times. For example, a Facebook user might see your content once when browsing your news feed, and again when a friend comments on that post – in a short space of time, you’ve created two impressions.
We’ve only scratched the surface of the performance metrics you can use to drive your content strategy. For those looking to cater to specific audiences, the possibilities for data interpretation within Facebook Insights go on and on.
Social Media Workshops at Studio Culture
Studio Culture provide workshops for those new to the business potential of social media, or for professionals who simply wish to sharpen their skills. Get in contact with us at 1300 200 113 or hello@studio-culture.com.au to organise a session.